Test Results and Recommendations: Soil pH and Lime
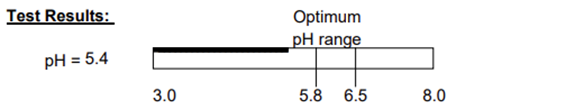
Soil pH indicates how acidic the soil is. Compare your soil pH to the graph on the report showing the recommended pH range for your crop. When the pH of the sample is lower than the optimum, a lime rate is provided. Optimum pH ranges for various plant types are given in the table below.
| Plant Type | Optimum Soil pH |
|---|---|
| Azalea, rhododendron, camellia, mountain laurel | 5.0–5.5 |
| Most shrubs and shade trees | 6.0 |
| Fescue, bermudagrass, zoysia, St. Augustine grass | 6.0–6.5 |
| Centipede grass | 5.5 |
| Rose | 6.5 |
| Berries and most fruit trees, except blueberries | 6.0–6.5 |
| Most vegetable and field crops | 6.0–6.5 |
| Tomato | 6.5 |
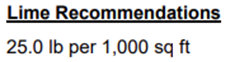
Lime recommendations: If the soil pH is low, apply the recommended amount of lime in pounds (lbs) per 1,000 square feet. Using lime at the suggested rate will raise the soil pH into the optimal range for two to three years, depending on the soil type. Lime should not be applied every year; applications should be based on the results of a current soil test.
- Lime can be applied at any time, but because it reacts slowly, it works best when added several months before planting.
- Incorporating lime into the soil speeds up its effectiveness. For new plantings, mix the lime into the soil to a depth of about 4 inches for lawns and 6 inches for vegetable gardens.
If lime was applied in the past year and a lime history was provided on the submission form, a lime recommendation may not be given even where the pH is not at the optimum for the specified crop. The recommendation considers unreacted lime previously applied.
Test Results and Recommendations: Nutrients and Fertilizers
Results:
• Phosphorus Index (P‑I): Shows the level of phosphorus (P) in your soil. Compare your P‑I to the optimum range of 50–70 on the graph.
• Potassium Index (K‑I): Shows the level of potassium (K) in your soil. Compare your K‑I to the optimum range of 50–70 on the graph.
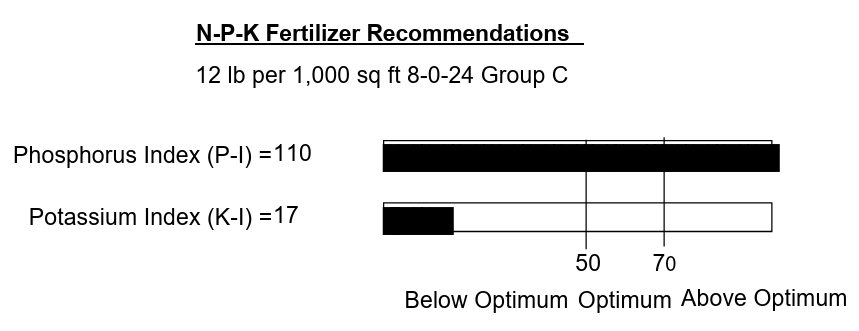
N-P-K Fertilizer Recommendations:
The fertilizer recommendation is based on your soil’s phosphorus (P-I) and potassium (K-I) levels and the seasonal nitrogen (N) need for the crop specified on the sample submission form. If P and K levels are already in the optimum range (>50), only nitrogen is recommended. Nitrogen is not measured on the soil test but plants need nitrogen (N) for healthy growth, so 1.0 pound (lb) of nitrogen per 1,000 sq. ft. is recommended—except for centipede grass, which requires only 0.5 pound of nitrogen per 1,000 sq. ft. Some vegetables may need extra nitrogen during the growing season.
The recommended fertilizer rate (lb/1000 sq. ft.) and grade (N‑P‑K) will supply the nutrients required for good plant growth. When the exact N-P-K grade recommended is not available at local fertilizer outlets, use the fertilizer N-P-K grade that most closely matches the recommended ratio. See the last page of the soil test report for additional information about fertilizer equivalency and adjusted rate recommendations. Find out more about how to interpret fertilizer grades in Note 8: Homeowners Guide to Fertilizer.
Additional Results
Most homeowners will not need the information in this section. However, for those interested in more detailed soil data, a few commonly requested results are included. More information about these results can be found in the NCDA&CS Crop Fertilization Based on North Carolina Soil Tests, which provides comprehensive guidance on crop fertilization for North Carolina soils.
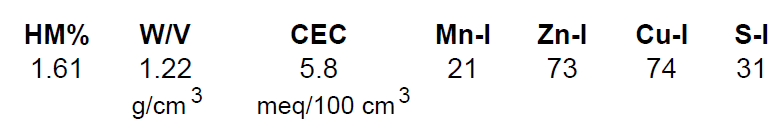
- HM% is the humic matter percentage measured and represents the portion of soil organic matter that is chemically stable.
- W/V is an indicator of soil texture. Very sandy soils often have a W/V more than 1.5 g/cm3 while silt and clay loams tend to be about 0.8 - 1.2 g /cm3.
- CEC is the Cation Exchange Capacity of the soil and indicates the extent to which a soil can hold positively charged nutrients such as calcium, magnesium, and potassium. In general, the higher the CEC, the better is its ability to retain nutrients. Sandy soils tend to have low CECs (< 3.0) and clayey soils and soils higher in organic matter tend to have higher CECs.
- Mn-I (Manganese Index), Zn-I (Zinc Index), Cu-I (Copper Index), and S-I (Sulfur Index) indicate the concentration of manganese (Mn), zinc (Zn), copper (Zn) and sulfur (S). Indexes greater than 25 indicate that those elements are likely sufficient for plant growth. Where an index is below 25 on a homeowner report, fertilizer recommendations are not provided due to the difficulty in applying very small amounts uniformly and because plant growth will likely be unaffected by these nutrients relative to N-P-K. Indexes greater than 2000 for Mn, Zn and Cu indicate that growers should reduce reliance on materials that allow for the long term accumulation of metals, such as manures.
This page was last modified on 07/15/2026