
The NCDA&CS Waste & Compost Analysis Lab analyzes approximately 13,000 samples per year. The data presented below is derived from manure samples received from 2010 - 2026. The typical range for each parameter represents the 25th to 75th percentile of the median, i.e. the middle 50% of all values. Concentrations are in lb/ton or lb/1000 gallons on a wet weight basis.
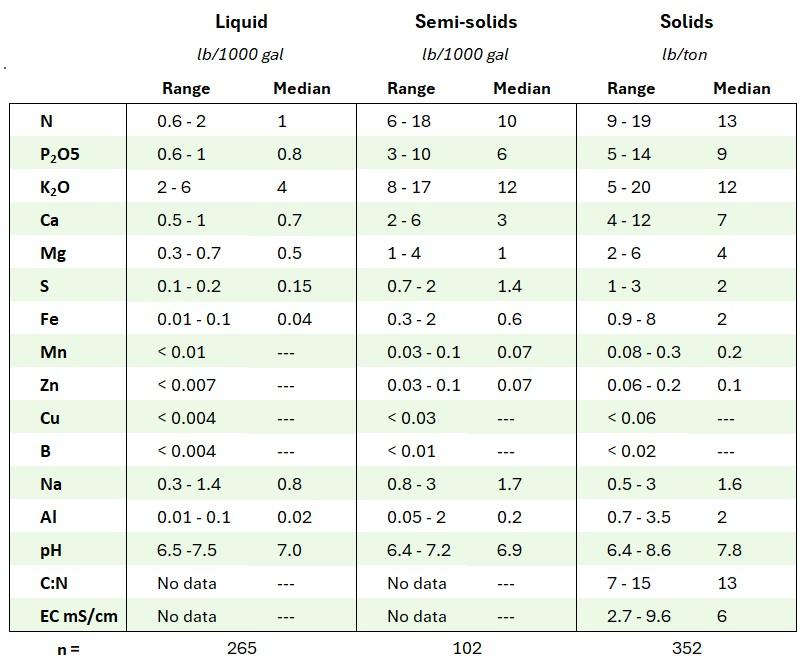
Dairy Manure
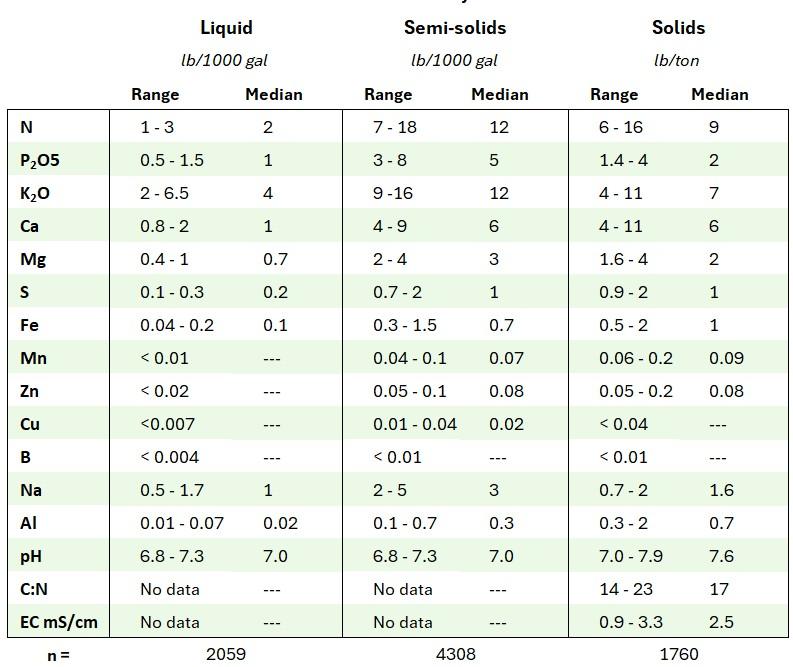
Poultry Manure
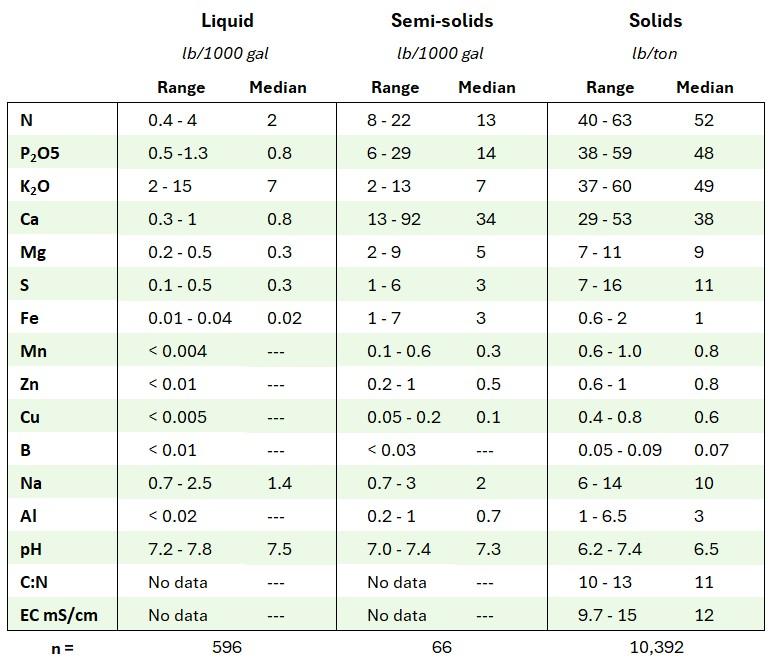
Swine Manure
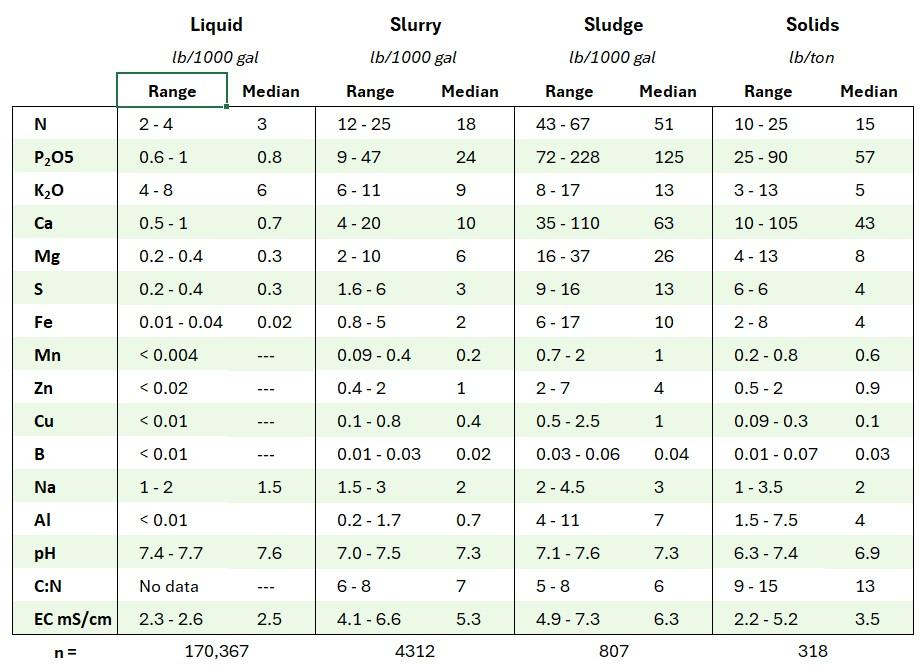
Other
On This Page Jump Links
Off