Understanding Your Waste Report
The waste and compost report provides information about using organic materials such as manure, compost, and crop residues as fertilizers and amendments. Incorporating these materials into a nutrient management plan can offset fertilizer costs and inputs.
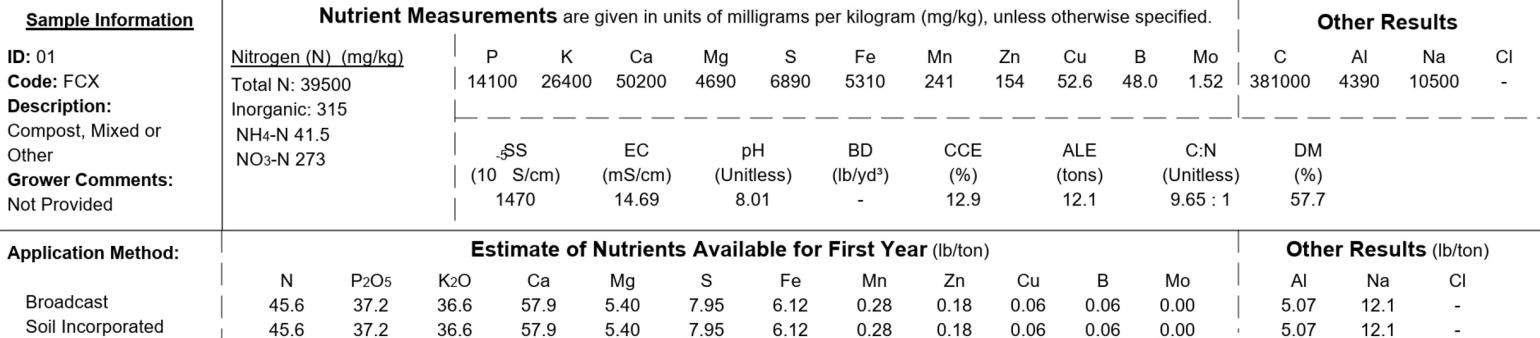
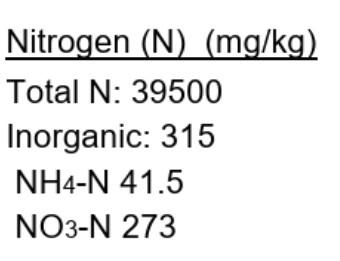
Nitrogen (N)
This is the total concentration of organic and inorganic nitrogen in mg/kg or mg/L for solids and liquids, respectively. Nitrogen is reported on an as-received (wet-weight) basis for all liquids and for all manure-based solids in mg/L and mg/kg respectively. Plant-based compost (FCW), compost made from mixed materials (e.g. plants and ash, plants and manure), and solid Industrial and agricultural by-products (e.g. paper fibers, ash, non-composted crop residues, etc.) are reported on a dry-weight basis in mg/kg.
Inorganic nitrate-nitrogen (NO3-N) and ammonia-nitrogen (NH4-N) are not part of the standard analysis but can be added by request.
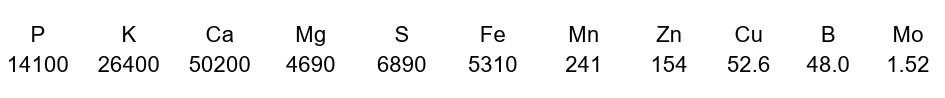
Other Nutrients
Concentrations of phosphorus (P), potassium (K), calcium (Ca), magnesium (Mg), sulfur (S), iron (Fe), manganese (Mn), zinc (Zn), copper (Cu), and boron (B) are reported in mg/kg for solids and mg/L for liquids. All solids are reported on a dry-weight basis. All liquids are reported on an as-received (wet-weight) basis. Molybdenum (Mo) can be added for a fee.
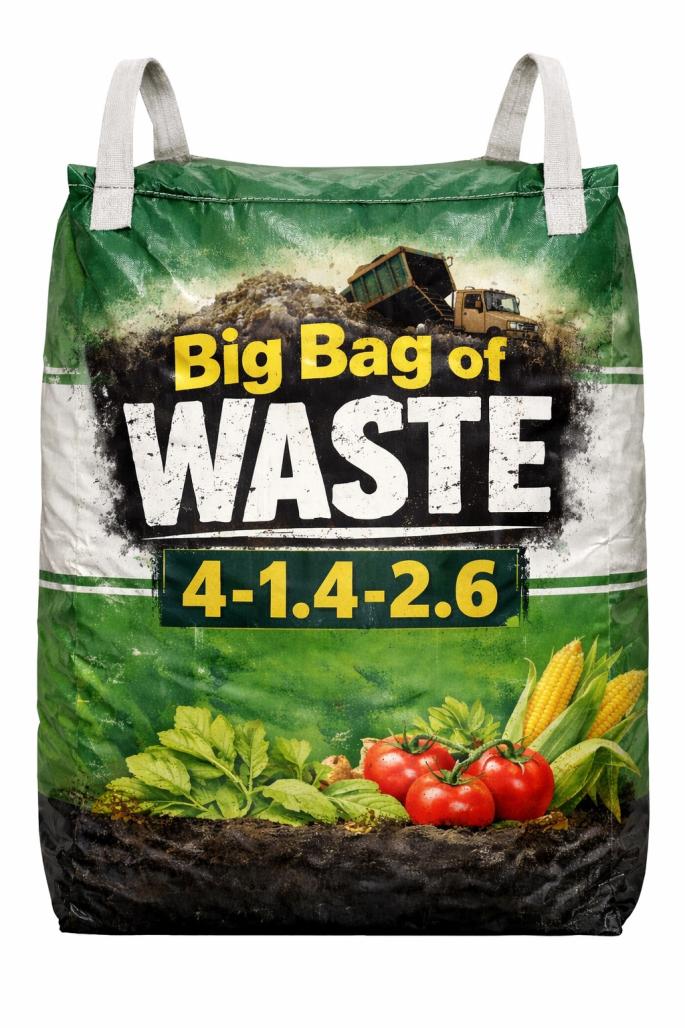
What is the "grade" of the waste material?
Imagine if you bought a big bag of this material, what would its fertilizer grade be? A fertilizer grade is the percentage of the nutrient in the material. To find the percentage, simply move the decimal point 4 places to the left. Let's use the example above.
| Nutrient | Nutrient Measurement from Report | Percentage |
|---|---|---|
| Nitrogen (N) | 39500 | 3.95 |
| Phosphorus (P) | 14100 | 1.41 |
| Potassium (K) | 26400 | 2.64 |
This material is about 4% N, 1.4% P, and 2.6% K and would have a NPK fertilizer grade of 4 - 1.4 - 2.6.
Important note: The Agronomic Division does not actually grade fertilizer or waste products.
Estimate of Available Nutrients
Concentrations are reported on an as-received (wet weight) basis for all elements in lb/ton for solids or lb/1000 gal for liquids.
Manure
For nitrogen only, the availability estimate depends on the manure type and application method specified on the submission form and accounts for the fact that only 40-60% of the nitrogen becomes available in the first year. The nitrogen availability for specific manure types was established by the North Carolina Interagency Nutrient Management Committee. For nutrients other than nitrogen (e.g. P, K, etc.), the reported concentrations are the total concentrations in the sample.
Non-Manure
The reported concentrations are the total concentrations in the sample. Due to the heterogeneity of these types of samples and other factors, actual nutrient availabilities have not been established.
Conversion Factors
Solid to Liquid
lb/ton × 4.17 = lb/1000 gal
Liquid to Solid
lb/1000 gal × 0.24 = lb/ton
Concentration
lb/ton = mg/kg x 0.002
lb/1000 gal = mg/L x 0.00834

How do we calculate the estimate of available nutrients?
- NAC or "Nitrogen availability coefficient" is depends on the waste code and application method and is established by the North Carolina Interagency Nutrient Management Committee.
- P and K require an additional conversion factor to convert to P2O5 and K2O. The CF for P is 2.29 and for K is 1.20.
- Dry Matter Percentage (DM%) is used to convert from a dry weight basis to a wet-weight basis and only applies to solid waste.
| Nutrient | Solid (lb/ton) | Liquid (lb/1000 gal) |
|---|---|---|
| Nitrogen (N) (Manure) | N mg/kg x NAC x 0.002 | N mg/L x NAC x 0.00834 |
| Nitrogen (N) (Non-manure) | N mg/kg x 0.002 x (DM% ÷ 100) | N mg/L x 0.00834 |
| Phosphorus (P2O5) | P mg/kg × 0.002 x 2.29 × (DM% ÷ 100) | P mg/L x 0.00834 x 2.29 |
| Potassium (K2O) | K mg/kg × 0.002 x 1.20 × (DM% ÷ 100) | K mg/L x 0.00834 x 1.20 |
| Other Nutrients | Nutrient mg/kg x 0.002 x (DM% ÷ 100) | Nutrient mg/L x 0.00834 |
Other Parameters
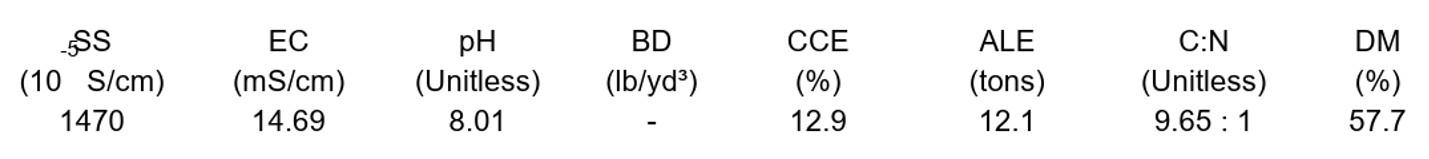
EC (Electrical Conductivity) is reported in units of mS/cm. It measures the total quantity of dissolved salts (ions) in solution and is used to estimate the total nutrient concentrations available to plants. However, it also includes elements such as sodium (Na) and chloride (Cl), which increase EC without providing nutritional value. In addition, excessively high EC will burn plant roots regardless of the whether the ions are required for plant nutrition.
SS (Soluble Salts) is the same as EC, but is expressed in units of 10-5 S/cm.
The pH is the level of acidity or basicity as measured by the amount of hydrogen ions (H+ ) in solution. It ranges from 0 (acidic) to 14 (basic) on a logarithmic scale; 7 indicates neutrality. It can reduce the availability of micronutrients (Fe, Mn, Zn, Cu, B) when pH is high (>6.5) and the availability of macronutrients (N, P, K, Ca, Mg, S) when pH is low (<5.0).
CCE% (Calcium Carbonate Equivalent) represents the acid-neutralizing capacity of a material expressed as weight percentage of calcium carbonate. For waste materials with liming potential (e.g., lime-stabilized biosolids, ash, poultry layer litter), the application rate may be limited by a high CCE%. Waste with a high CCE% should only be applied at rates needed to increase soil pH to the desired target. Overapplication can lead to high soil pH, which may limit micronutrient availability.
ALE (Agricultural Lime Equivalent) indicates the amount of the sample material that provides a liming effect equivalent to one ton of agricultural grade limestone. For example, an ALE of 2 indicates that 2 tons of the sample material would have the same liming effect as one ton of limestone.
Carbon (C) is measured on solid organic materials primarily to determine the carbon to nitrogen ratio (C:N). The Carbon to nitrogen ratio is an important parameter in composting, both for feedstocks and finished product.
DM% (Dry Matter) is the percent of the as-received sample that is dry solids and is inversely related to percent moisture. It is used in semi-solid and solid samples to convert the dry-weight nutrient measurement concentrations (mg/kg) back to wet-weight concentrations of the original sample, which are reported in the estimate of nutrients available for first year (lb/ton).
Heavy metal testing is optional and can be included by request at submission and for an additional charge.
| Heavy Metal | Maximum Concentration in Compost |
|---|---|
| Arsenic (As) | 41 mg/kg |
| Cadmium (Cd) | 39 mg/kg |
| Chromium (Cr) | N/A |
| Nickel (Ni) | 420 mg/kg |
| Lead (Pb) | 300 mg/kg |
| Selenium (Se) | 100 mg/kg |
Sodium (Na), chloride (Cl), and aluminum (Al) are elements that may be important for plant nutrition but are more often detrimental to plant health in excessive levels. Aluminum is not a plant nutrient and may create toxicity when soil or substrate pH is excessively low.
This page was last modified on 07/23/2026